
Evidence for business owners
Cash flow statistics for SMEs and startups: France and Switzerland
National figures provide context. Decisions require your own receipts, inventory and payment schedule. This selection separates published observations from Mercova’s illustrative calculations.
Sources checked on 13 September 2026. Observation years: 2024 for France, 2023 for Switzerland.
Analysis and interpretation: Steven Collard, Mercova
France: the cash impact of payment delays
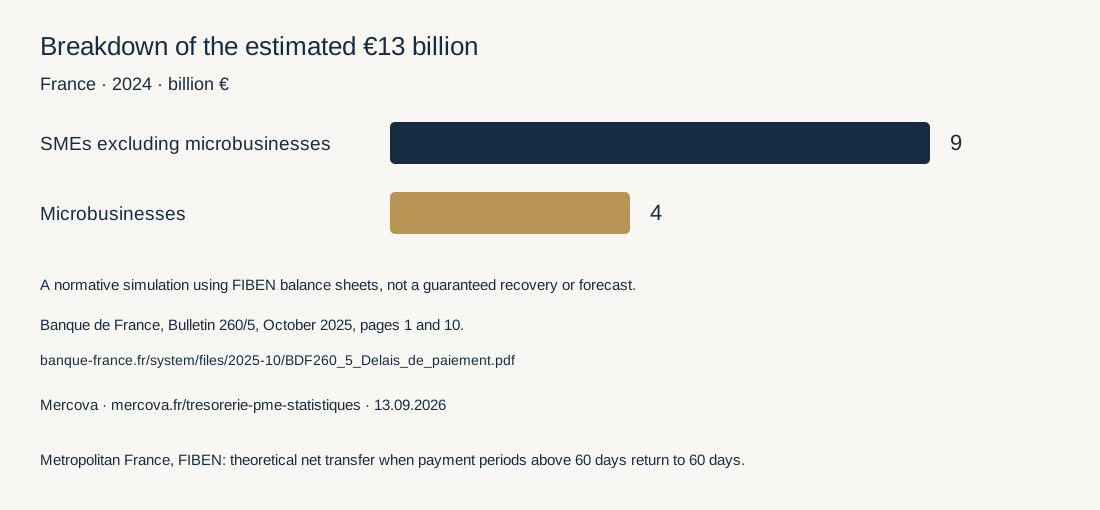
€13 billion
Theoretical net cash gain for SMEs including microbusinesses in the 2024 simulation.
52%
Large companies paying suppliers after more than 60 days on average in 2024.
Banque de France, Bulletin 260/5, October 2025, pages 1 and 10. Read the source
A normative simulation using FIBEN balance sheets, not a guaranteed recovery or forecast.
Switzerland: a separate population
624,219
Market economy SMEs in Switzerland in 2023, according to FSO data presented by SECO.
This national count measures neither French speaking Switzerland alone nor demand for finance support.
SECO SME portal, FSO STATENT data, August 2025. Read the source
What to look for in your monthly financial review
Identify customers tying up cash
An average collection period can conceal a few large invoices. Reconcile receivables with due dates, disputes and expected receipts. The useful question is who will act on each invoice, and by when.
Separate profit from available cash
A sale can raise profit before payment arrives. Inventory purchases and loan repayments can consume cash without an equivalent income statement charge. Your monthly report should explain these differences.
Connect the number to a decision
A useful review ends with a specific priority: resolve a customer dispute, adjust purchasing, reschedule spending or prepare a bank discussion. The next monthly review establishes what actually changed.
Example: how much do ten receivable days represent?
With annual revenue of 5 million, entirely on credit, ten days represent roughly 136,986 in receivables. The arithmetic works in euros or Swiss francs when every input uses the same currency.
5,000,000 ÷ 365 × 10 = 136,986
Illustration excluding tax, assuming steady activity. A shorter collection period does not guarantee this cash receipt: timing, defaults, seasonality and credit sales matter. Inventory and payables require cost and purchase bases rather than revenue.
Method and reuse
The French simulation brings customer and supplier payment periods above 60 days back to that threshold. The result is a theoretical net transfer, not total unpaid invoices. It covers the FIBEN study population in metropolitan France. Original producers retain attribution, with observation years, populations and units preserved. French figures do not measure Swiss payment delays. The chart is Mercova’s representation of the cited data. Reuse it with the original source, observation year and a reference to this page.
First published on 13 September 2026. Observation years remain explicit until a new publication is verified.
Apply the analysis to your business
Tell us about your business, your accounting setup and the financial question you need to understand.